Financial Statements Analysis, or “How to read a set of financial statements”
Financial statements analysis.
At this point, we understand how to create a set of financial statements. But how do we “read” a set of financial statements prepared by someone else? Financial statements analysis helps us to look at a set of financial statements and read how well the business is doing – in the past, present and anticipated future. When we analyse the financial statements, we also look at the financial strengths and weaknesses of the business.
We do all of the above by using financial ratios, which consider a business from 4 different aspects. We call these: 1. Liquidity ratios 2. Activity ratios 3. Gearing ratios 4. Profitability ratios
Liquidity Ratios
Liquidity ratios measure whether a business can repay its bills/debts on time. The focus is on short-term or current assets, because these can be readily utilized to settle debts. The more short-term assets a business has, the more liquid its position is.
Liquidity ratios include the current ratio, which is sometimes called working capital ratio or banker’s ratio. It measures a business’ ability to pay its current liabilities (liabilities that are due within 1 year). The formula for calculating the current ratio is:

The higher the current ratio, the more liquid the firm’s position. As a rule of thumb, the current ratio should be more than 2.
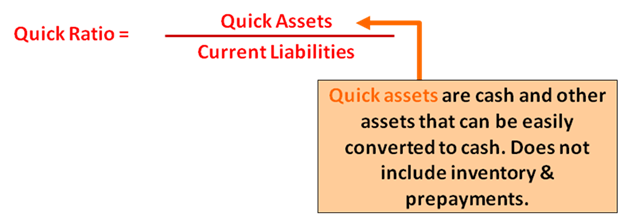
Another liquidity ratio is the quick ratio, sometimes called the acid-test ratio. This measures the ‘instant’ debt-paying ability of a business, as is computed as:
Activity Ratios
Activity ratios measure how effectively a business uses its assets to generate income or revenue. In other words, they measure how well a business earns income with its current level of assets. A smart business is able to utilize a minimal level of assets to generate a healthy level of income. These ratios are sometimes called efficiency, turnover or business asset management ratios.
The inventory turnover is an activity ratio that assesses the efficiency of a business in managing its inventory. It tells of how many times the inventory is replaced/sold within a period. According to financial statements analysis: the higher the figure (in other words, the more times the inventory is replaced), the better – because this means that sales are increasing and inventories are fast-moving (instead of being stocked up). A low turnover figure usually means that sales are down and inventories are slow-moving – perhaps demand for the goods is low.

Note that we obtain the average inventory figure by adding the opening inventory for the period to the closing inventory, and then dividing the sum by 2. This is done so that we get an average inventory level over the period instead of a certain inventory level at one point in time. Of course, we can get an even better average if we take the inventory level at the end of each month (over, say, a 12-month period), add them all together, and then divide the sum by 12 – if we are able to get this information.
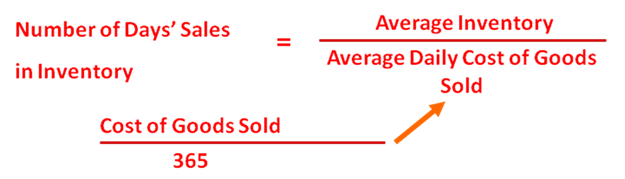
Number of days’ sales in inventory is a rough measure of the length of time it takes to purchase, sell and replace the inventory. Notice that this is measured in terms of number of days. The higher the number of days, the longer it takes for a business to complete the cycle of purchasing, selling & then replacing the sold inventory. The less days this process takes, the better – because it means that sales are healthy and inventory is fast-moving. Notice that this ratio measures the same thing as that of the above inventory turnover – the only difference is that inventory turnover is expressed in terms of the number of times the inventory is replaced, and number of days’ sales in inventory is expressed in terms of number of days.
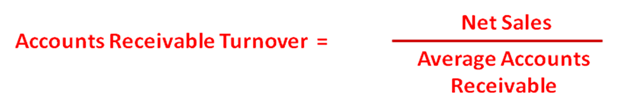
Accounts receivable turnover measures the speed in which trade debts are collected. Obviously, the faster the debts are collected, the better it is for the company (as more cash is received). Hence, the higher this ratio is, the more effective the business is in collecting from its credit customers.
As with average inventory above, note that we obtain the average accounts receivable figure by adding the opening accounts receivable for the period to the closing accounts receivable, and then dividing the sum by 2. This is done so that we get an average accounts receivable level over the period instead of a certain level at one point in time.
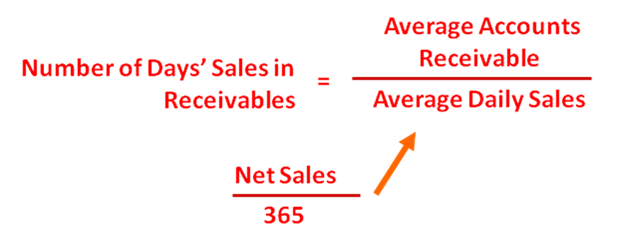
Number of days’ sales in receivables is an estimate of the length of time the accounts receivable has been outstanding. Notice that this is measured in terms of number of days. According to financial statements analysis: the higher the number of days, the longer the time customers have not been paying their debts – which, frankly, is bad news because it could mean many things: customers experiencing a decline in sales, customers having cash flow problems, customers going bankrupt, etc. When customers go through a bad time, there is a high chance that their debts will not be paid AT ALL. Notice that this ratio measures the same thing as that of the above accounts receivable turnover – the only difference is that accounts receivable turnover is expressed in terms of speed of debt recovery, and number of days’ sales in receivables is expressed in terms of number of days.
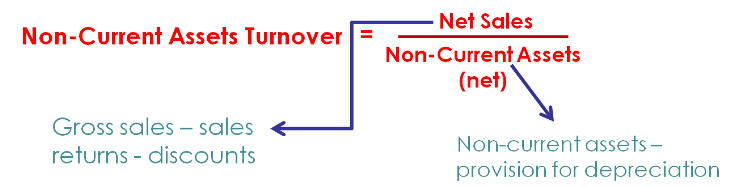
The fixed assets (or non-current assets) turnover ratio measures how effectively the business uses non-current assets to generate sales. The higher the ratio, the more efficient the firm is in doing this. It is computed as follows:
Total assets turnover ratio is a measure that shows how effectively a business utilizes its assets – in other words, how much sales a business is able to generate from money invested in total assets. The higher the ratio, the better. It is computed as follows:

Gearing Ratios
Gearing ratios measure how a firm uses outside funds, or liabilities, to finance its assets. The most common example of this is when businesses, when starting or expanding operations, take bank loans to buy shoplots or inventory. Gearing ratios are sometimes called leverage ratios, because they measure how a business leverages on its debts to pay for its assets.
The debt ratio measures the percentage of total liabilities to the total assets of the business.

The lower the ratio, the better it is for the business as it is less financed by outside parties. Because of that, the business has a higher ability to obtain more outside funds when there is a need to do so. A firm which is already highly geared (has a lot of debts) would find it harder to raise funds. As debt increases, generally the number of creditors/lenders increase as well. Lenders are generally divided into 2 camps: secured and unsecured. Secured lenders are safer, because the debts are attached to collateral/designated assets. Should the business fail to repay the debt, the collateral can be sold for repayment accordingly. Unsecured lenders do not have such collateral, and run the risk of not being paid at all should the business have liquidity problems or go bankrupt. New lenders are typically afraid that they need to queue up for repayment behind existing lenders – especially so if they are unsecured.
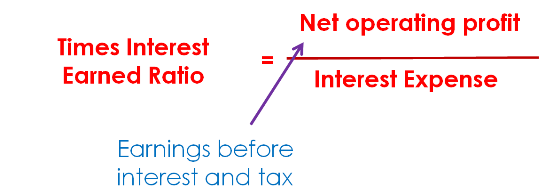
The times interest earned ratio measures the number of times a business is able to repay fixed interest from its net operating profit. It is also called the interest cover ratio (as it measures how much net operating profit is able to cover interest payments. According to financial statements analysis: the higher the ratio, the better.
The debt to equity ratio measures long term debt (owing to outside parties) to owner’s equity (what is retained within the business), and indicates the margin of safety for creditors. The lower the ratio, the better for the business.

Profitability Ratios
Profitability ratios measure the firm’s ability to produce profits from its assets – they are also an indication of the firm’s efficiency. The higher the ratios, the better.
These ratios can be further categorized into: 1. Those based on sales (gross profit margin, net profit margin) 2. Those based on assets/resources (operating profit to total assets ratio, return on assets ratio, return on common equity).
Gross profit margin measures the profitability of a firm over a period of time, and indicates how much profit is made per sales generated. It is expressed in the form of a percentage.

Net profit margin indicates what is available to owners from the net sales, after considering all expenses.

Return on assets ratio (also known as the return on investment ratio) measures the profitability of assets utilized – in other words, how well profits are generated from the utilized assets. The higher the ratio, the better the return on the use of assets by the firm.

Return on common equity (ROCE) measures the net profit against the amount invested by the owners/shareholders, in a company organisation. It indicates what the owner/s earn/s from his/their investment into the business.

Notice that in the ROCE, preferred dividends is taken out from net profit after tax. These refer to dividends paid to preference shareholders, who get a fixed return on their share investment, whether or not the business makes a profit. These preference shareholders are different from ordinary shareholders, who may or may not receive dividends in a particular year, depending on the company's performance. Preference shares, or equity, are NOT part of common equity - but ordinary shares/equity are.
Inter- and intra-firm comparisons
The above financial ratios are valuable tools for performing financial statements analysis: for making comparisons on the performance of different firms, and for benchmarking a firm against industry averages/norms, which is obtained by averaging out the ratios of a good sample of firms within a similar industry. Different industries may exhibit different norms; for instance, supermarkets in general have low liquidity ratios but high activity ratios as compared to, say, jewellery shops which are the opposite.
Financial statements analysis can also be performed for the same firm over a period of time, say over the past 5 years – this is called trend analysis. This is done to review the performance of a firm over time, to see if a business has improved or deteriorated, and to formulate future strategy.
Return to Accounting Adventurista Home from Financial Statements Analysis
Want to refresh your memory on the Accounting Equation? Go here from Financial Statements Analysis.