Cost Behaviour
Every business will incur costs, and the cost behaviour of each will be different. We need to understand cost behaviour, i.e. how different costs behave, so that we can make the correct costing decisions.
In general, costs behave in 2 ways – although we will see later that there may be variations, depending on the circumstances.
Variable costs
Variable costs change in total in proportion to changes in the related level of total activity or volume. For example, assume that Twinklebell Bicycles buys a handlebar at $52 for each of its bicycles.
The total handlebar cost when 1,000 bicycles are assembled is: 1,000 units × $52 = $52,000
The total handlebar cost when 3,500 bicycles are assembled is 3,500 units × $52 = $182,000
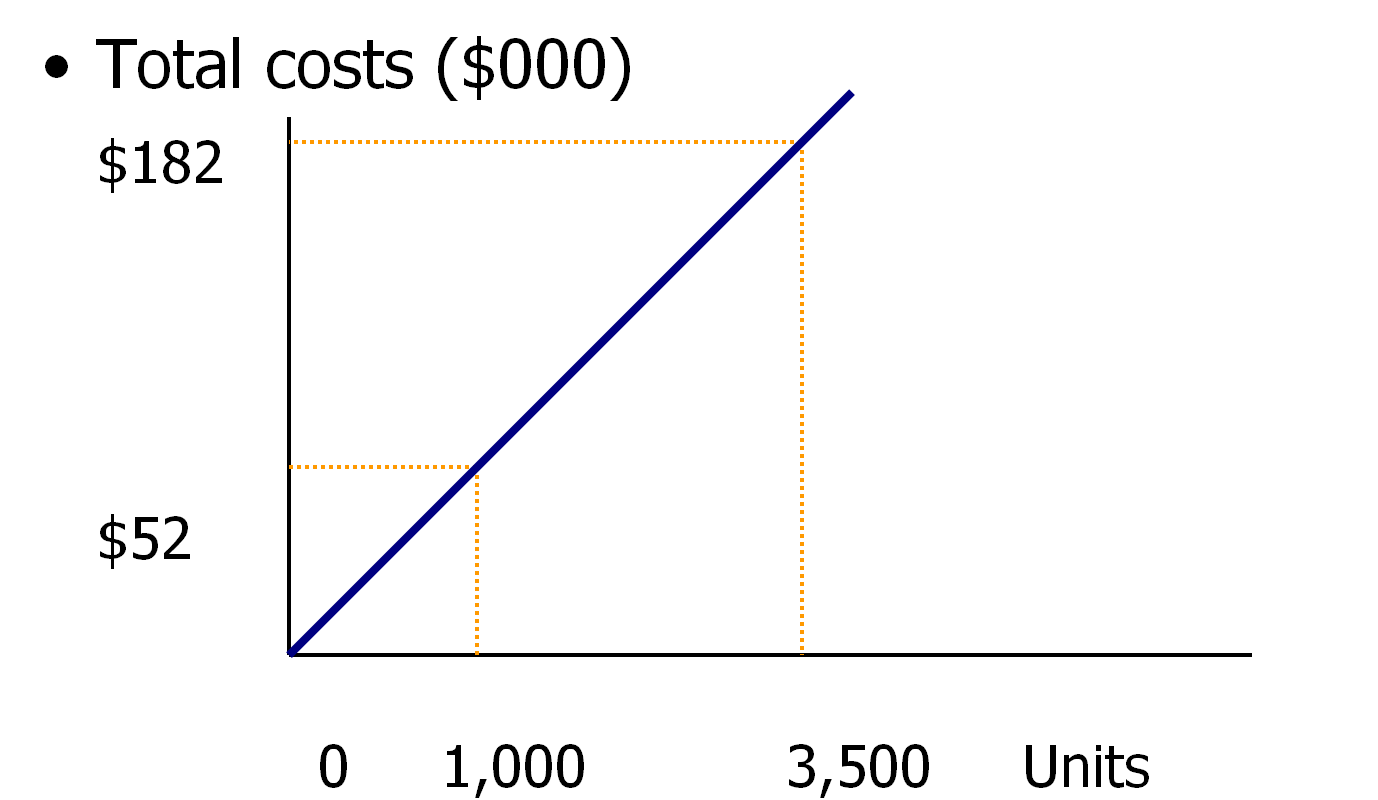
The total handlebar cost is an example of a cost that changes in proportion to changes in the number of bicycles assembled. Hence it is a variable cost.
Fixed costs
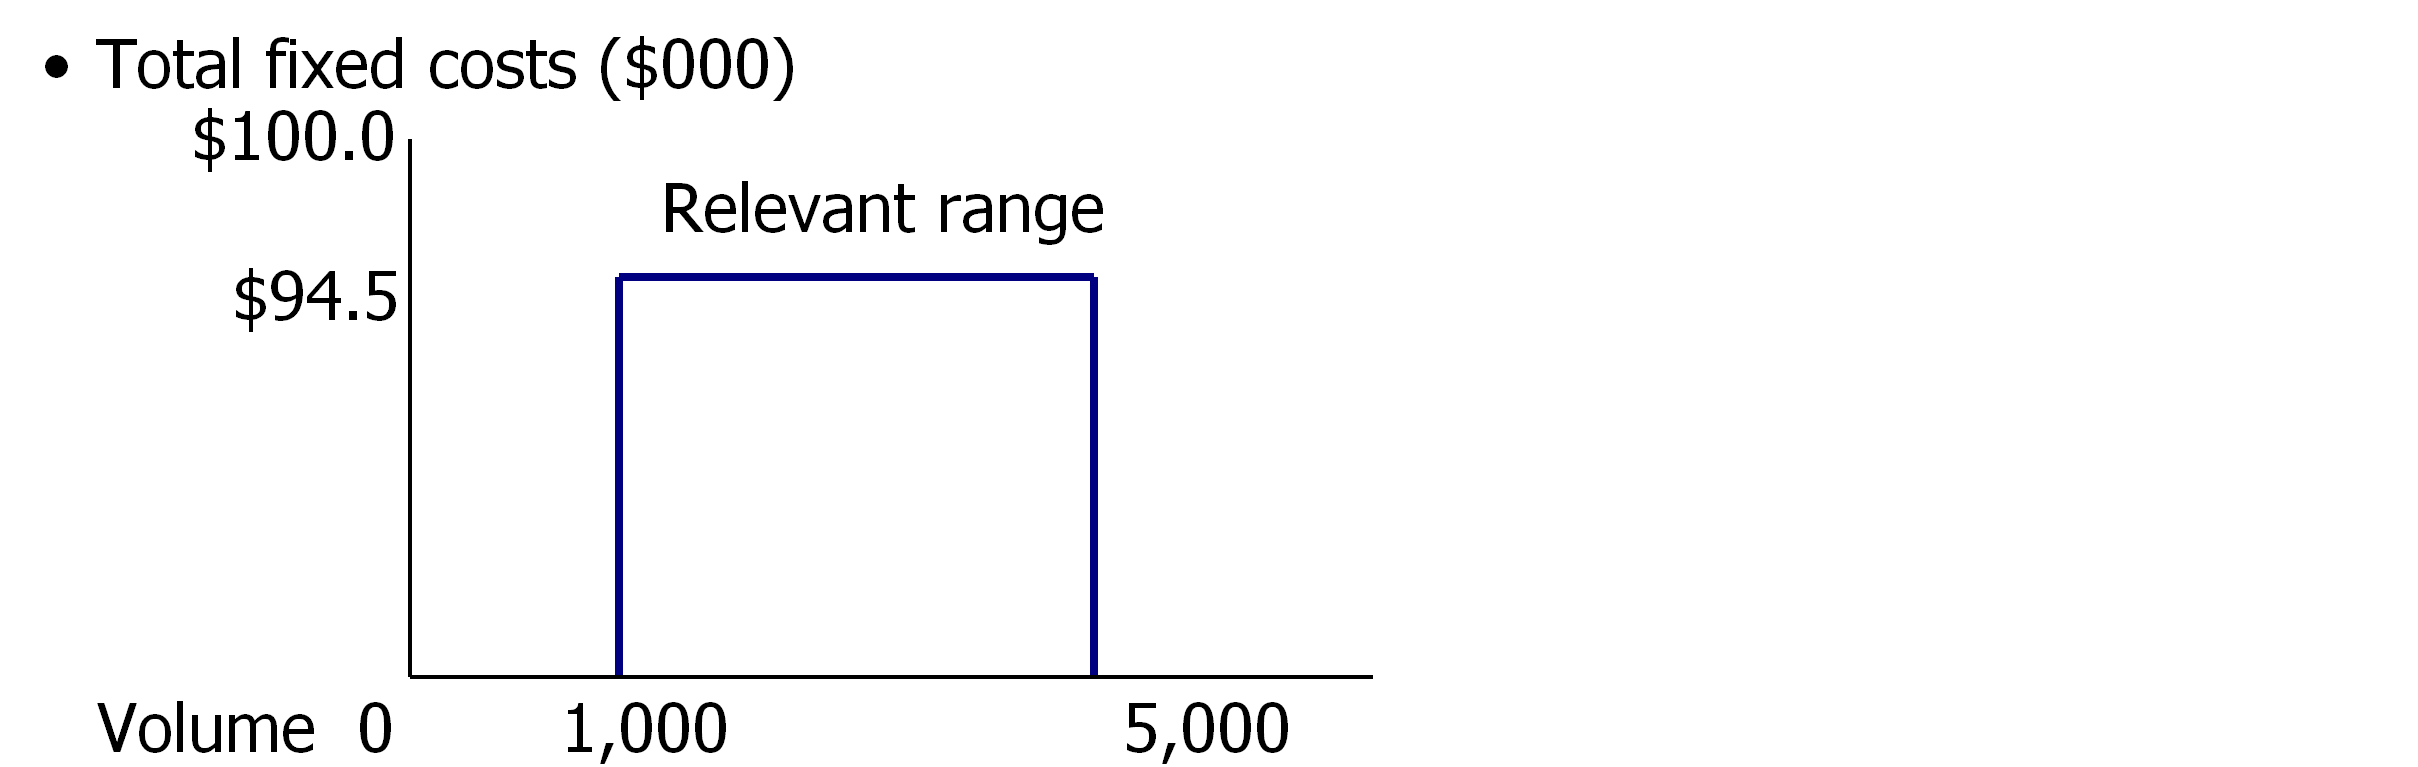
Fixed costs do not change in total for a given time period despite wide changes in the related level of total activity or volume.
For example, assume that Twinklebell Bicycles incurred $94,500 in a given year for the rental of its plant. The rental cost remains the same irregardless of the number of bicycles assembled. Hence, plant rental costs are fixed costs.
Fixed costs are unchanged, but this is true only for a certain range, during a given time period. For example, the rental costs of $94,500 a year will remain fixed for the output level of, say, 1,000 to 5,000 bicycles. Hence, 1,000 to 5,000 bicycles is the relevant range. Why would there be a relevant range? This is because if Twinklebell manufactures more bicycles than 5,000, it would need to rent additional space, perhaps a larger plant, which would increase its fixed costs.
Let’s view this in a graph:
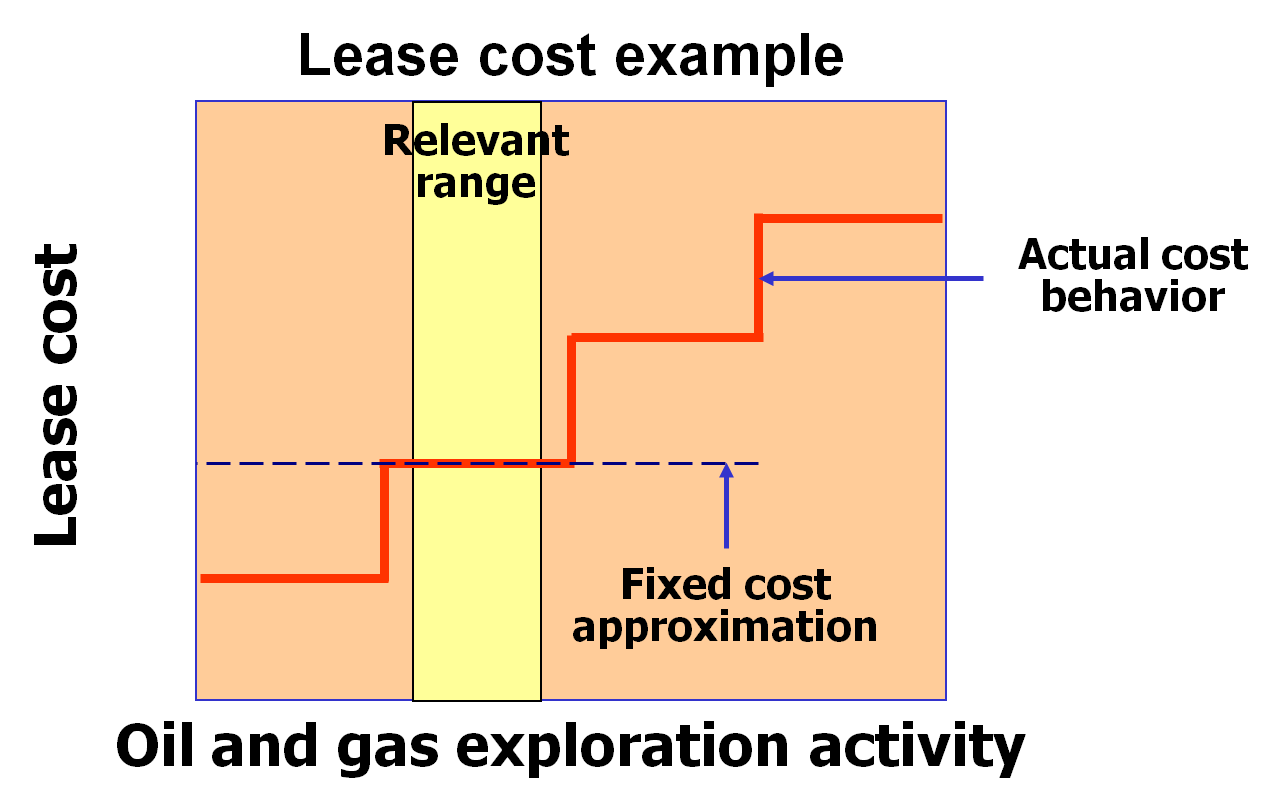
Step costs (semi-fixed costs)
Step costs are a variation of the fixed/variable cost models.
An example is that of the leasing of an oil rig. Let’s say that the oil & gas exploration activity, using 1 rig, is currently drilling at 2,000 barrels per day. Any more than 2,000 barrels and up to 4,000 barrels will need the leasing of an additional oil rig. Hence, we can see from the following graph that the leasing costs will follow a staircase pattern.
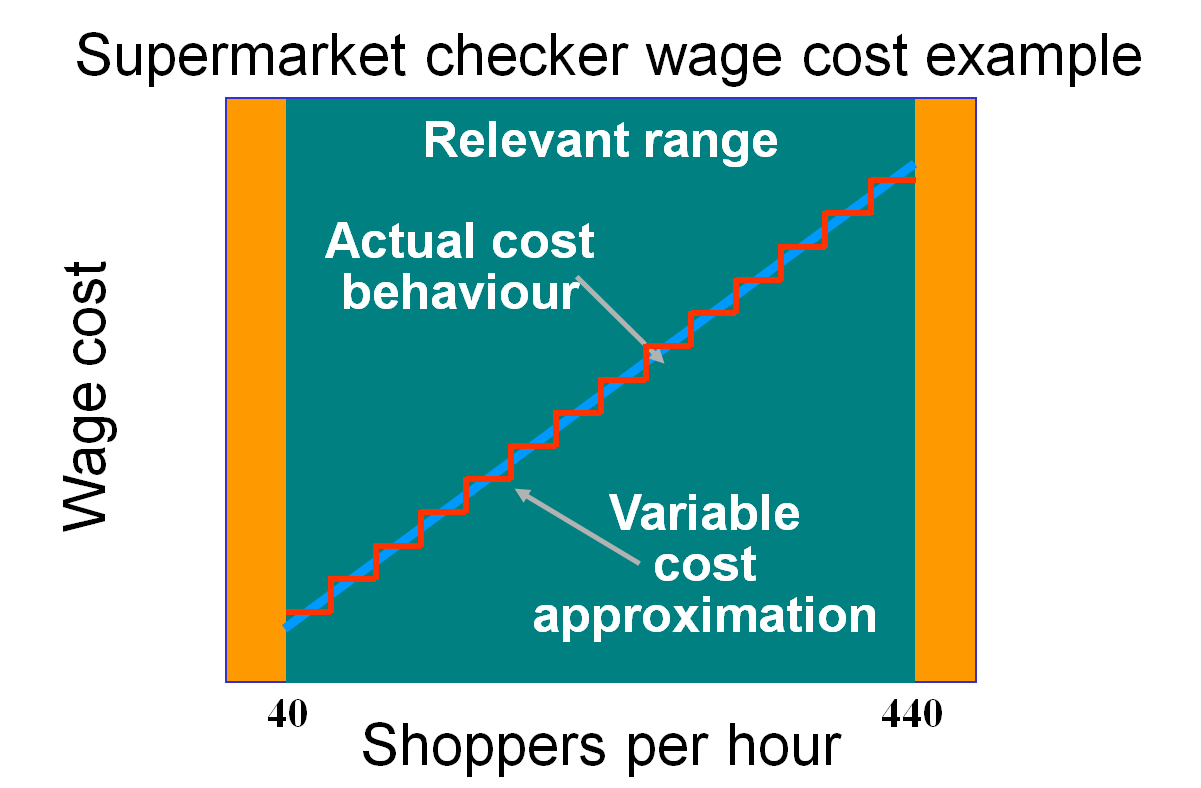
Here’s an example of the wage cost of supermarket checkers (cashiers). Let’s say that 1 cashier can serve 20 shoppers per hour. But supermarkets are busier during certain hours, such as during lunch time or after work. During those times, the number of shoppers per hour is more and hence more cashiers are needed. The graph of wage costs, plotted against shoppers per hour, will look like this:
Mixed costs (semi-variable costs)
Mixed costs are another variation of the fixed/variable cost models.
In this structure, the total cost behaviour has both fixed and variable elements.
Let’s look at an example of the costs of a maintenance department at a hospital, as depicted in the following graph:
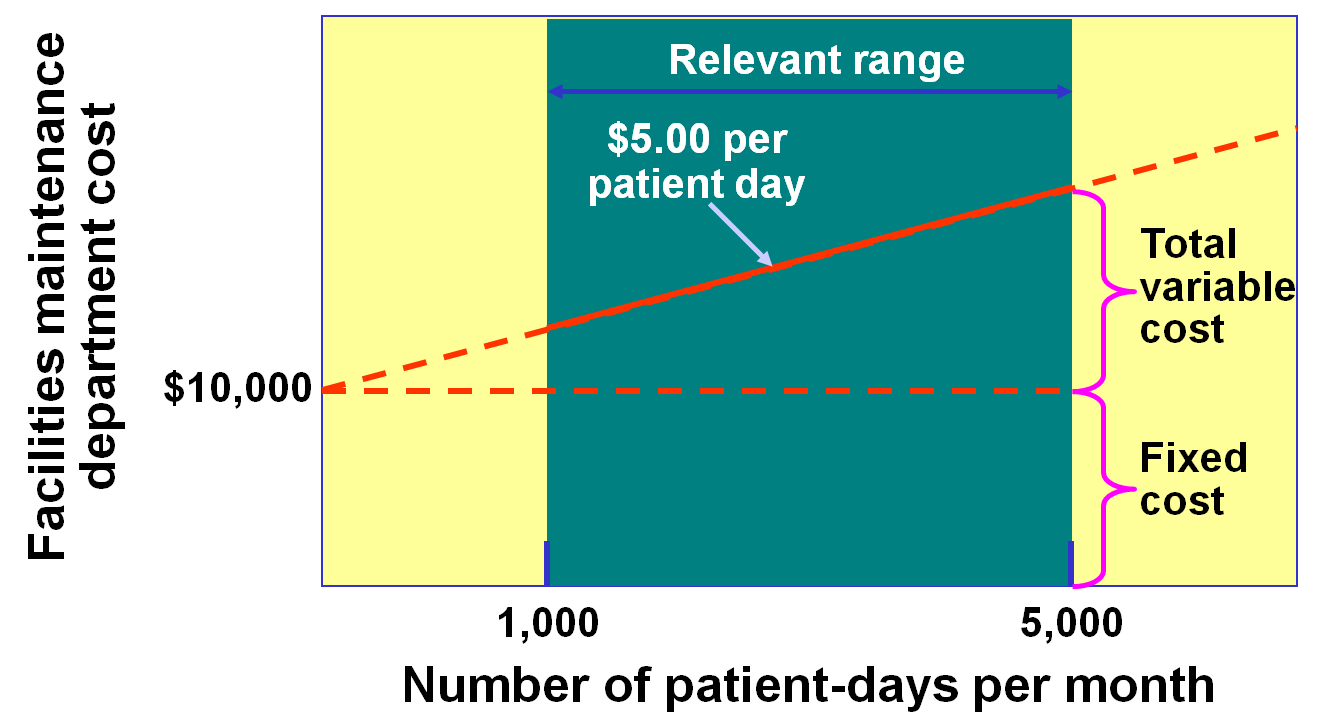
Notice that the graph line does not start from zero, but starts at $10,000, which are the fixed costs. Fixed costs comprise the salary of the department supervisor, which need to be paid irregardless of the number of patients admitted to the hospital. Thereafter, costs will increase depending on the number of patients admitted – this is the variable costs portion, which comprise costs related to cleaning supplies. In other words, the cost behaviour is such that the higher the number of patients, the more the supplies needed.
Return to Introduction to Management Accounting from Cost Behaviour.