Cost-Volume-Profit Analysis
Cost-Volume-Profit Analysis
Now that we understand what variable and fixed costs are (Refer to Cost Behaviour), let us explore how we can use the Cost-Volume-Profit Analysis (CVP) to make beneficial decisions.
First of all, what is CVP? It is the study of the effects of output volume on revenue (sales), expenses (costs), and net income (net profit).
For example, let’s look at the following scenario, where a business intends to sell a product item. The selling price is 50 cents and the variable cost is 40 cents. Other than that, the business has to incur monthly fixed expenses of rent, wages and other expenses to a total of $6,000.
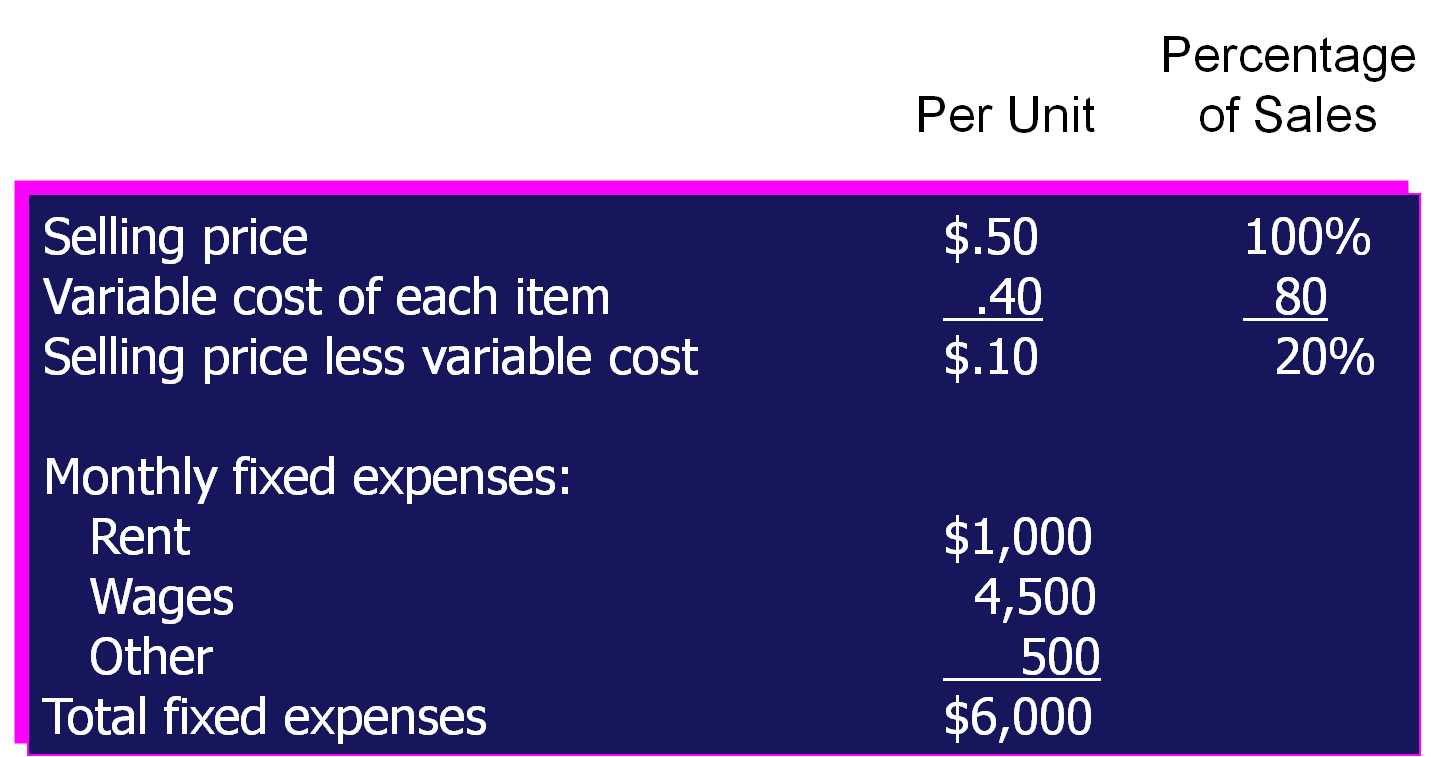
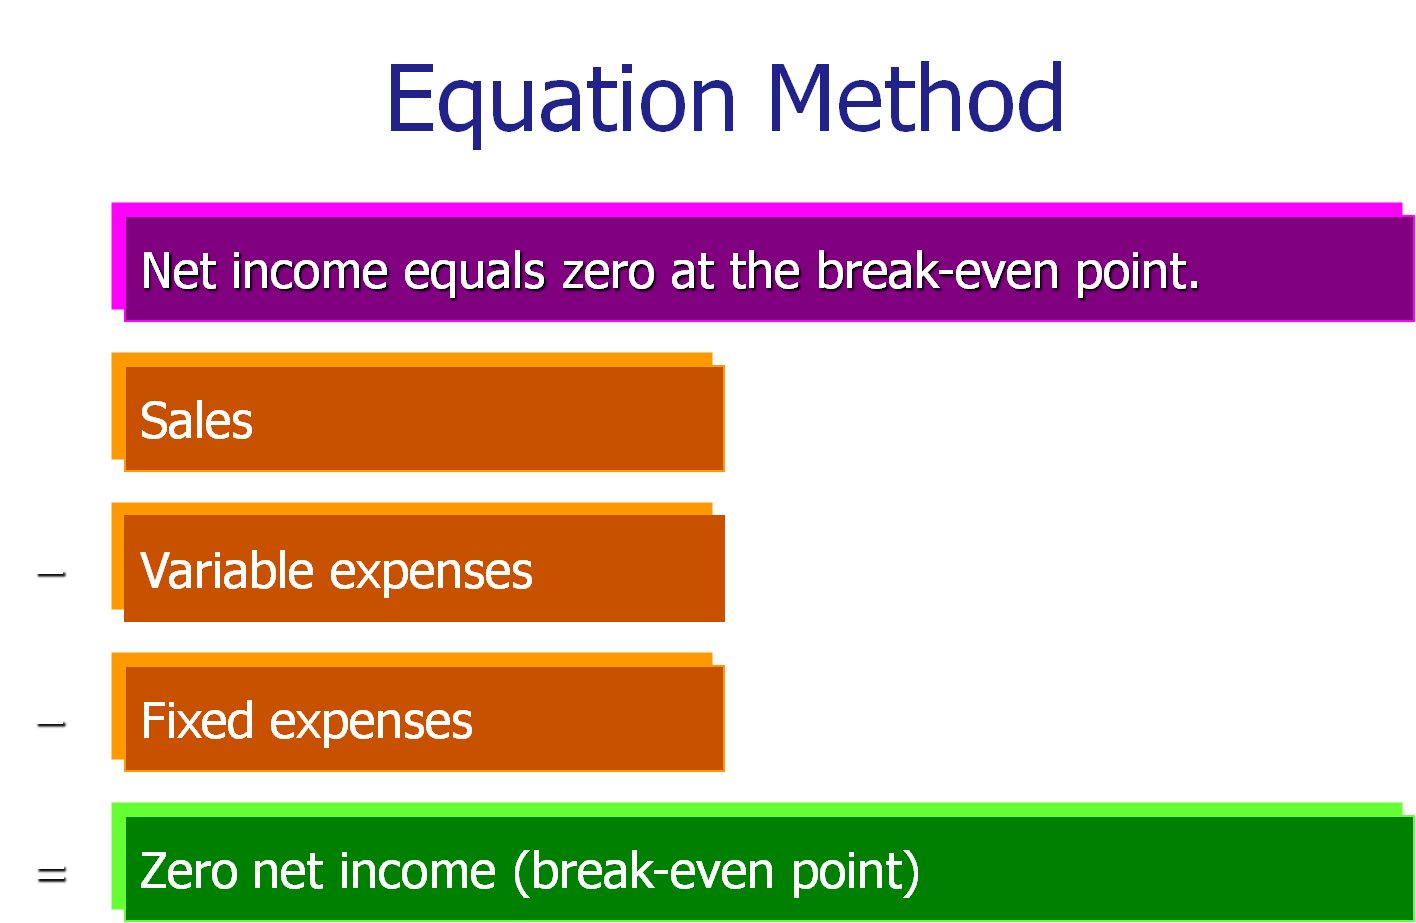
With this information, the first thing we need to know is the break-even point, which is the level of sales at which revenue equals expenses. In other words, the break-even point is the point at which the business makes zero profit and zero loss.
We calculate break-even point in the following way:
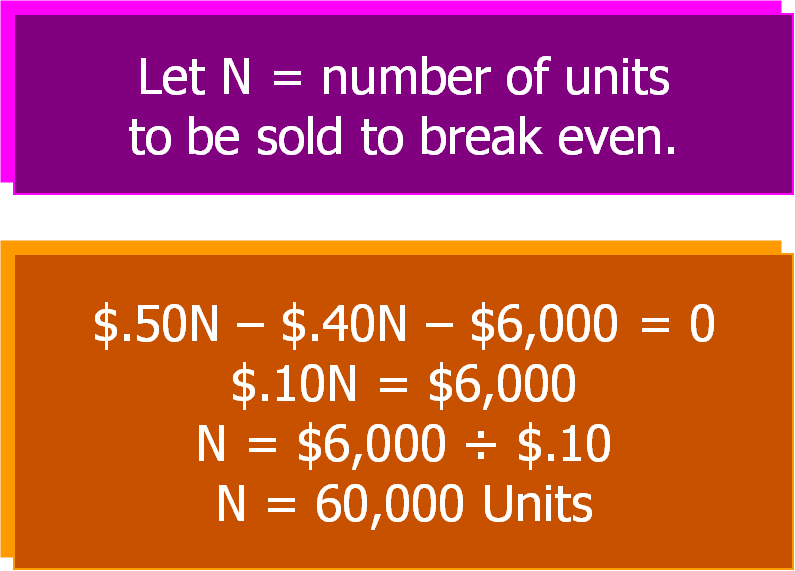
Break-even point as stated in number of units to be sold:
Break-even point as stated in the amount of sales to be made:
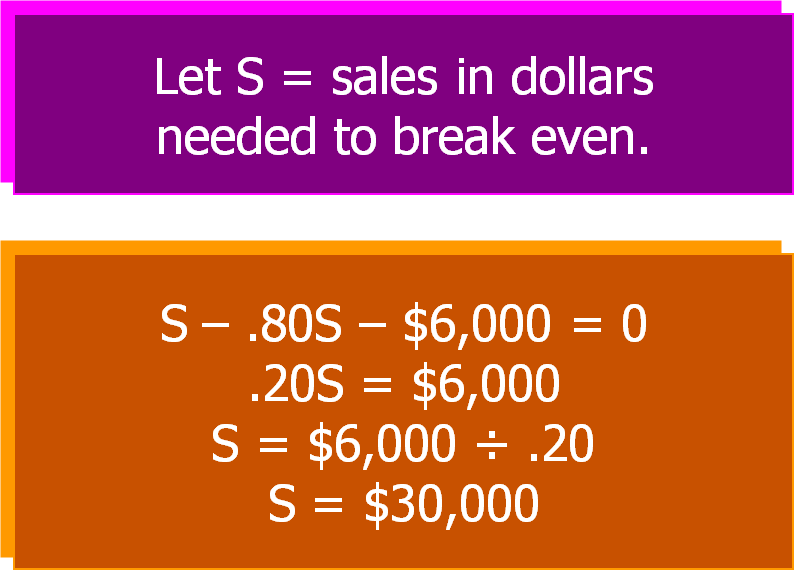
In other words, the business will need to sell at least 60,000 product units or make sales worth $30,000 in order not to make a loss.
The Cost-Volume-Profit Analysis graph sums this up as follows:
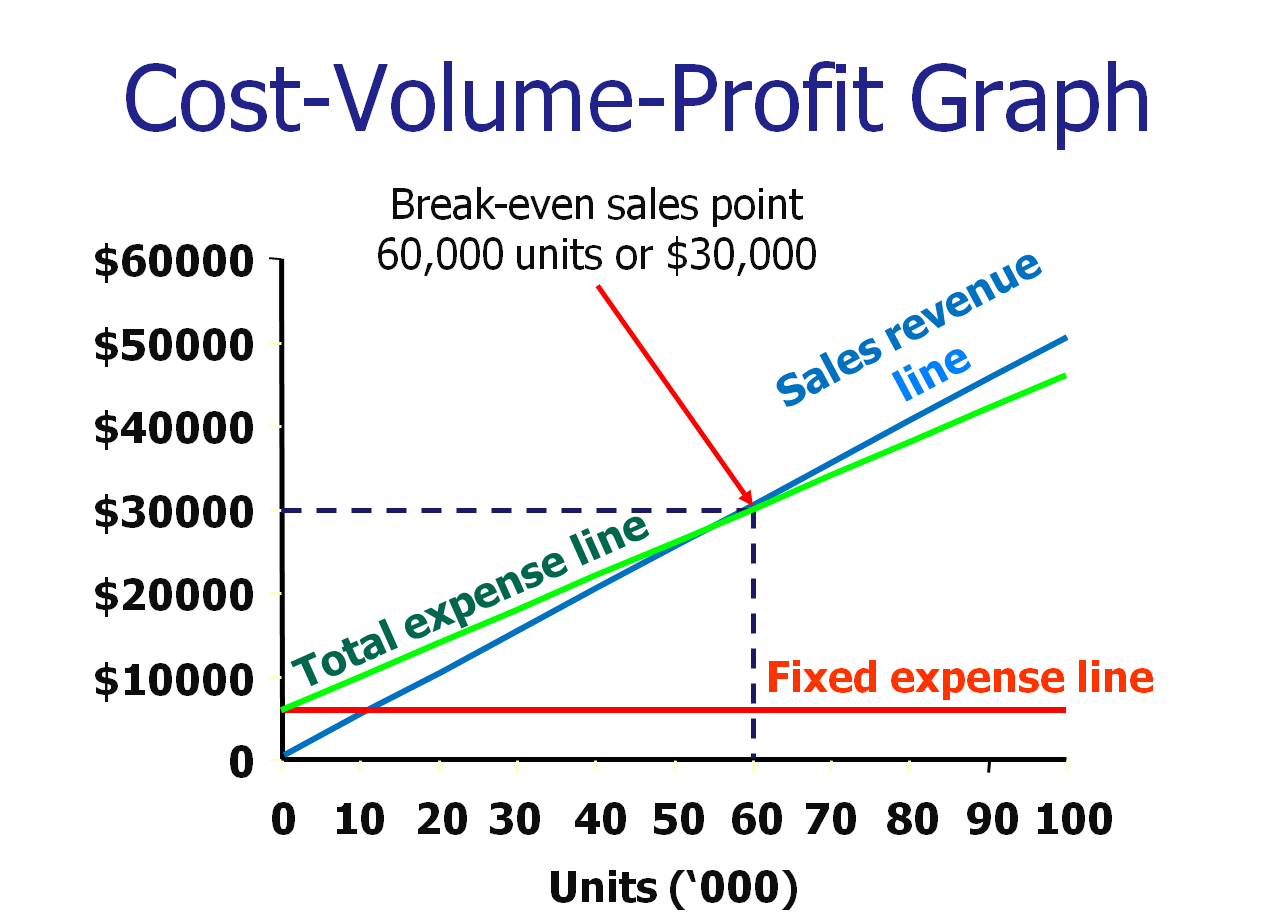
The light blue line is the Sales Revenue line – notice that it begins at zero. In other words, if zero units of product is sold, then total revenue is zero. As more and more units are being sold, the revenue increases. The red Fixed expense line stays flat irregardless of the number of units sold. The Total expense line represents fixed and variable expenses. At zero units, the fixed expenses remain; as more and more units are sold, the variable expense component kicks in & increases in line with the number of units sold.
The break-even point is where the Sales revenue line and Total expense line meet. Notice that before that point, the Total
expense line is higher than the Revenue line, depicting a loss. After that point, the Revenue line is higher,
depicting that the business has started to make a profit.
What are the applications of the CVP Analysis?
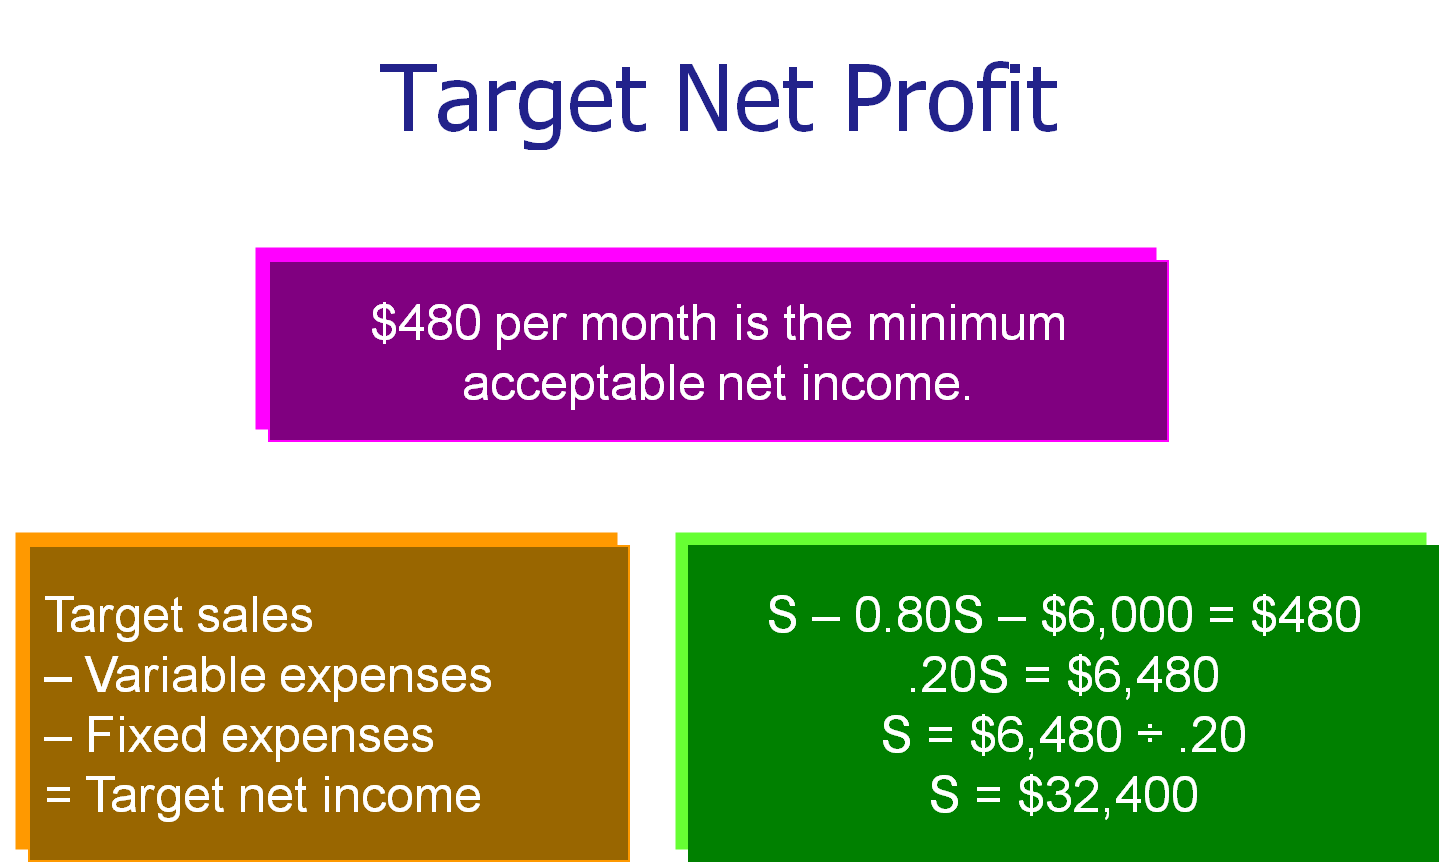
1. Setting a target net profit
Managers can use Cost-Volume-Profit analysis to determine the total sales, in units and dollars, needed to reach a target net profit.
For example:
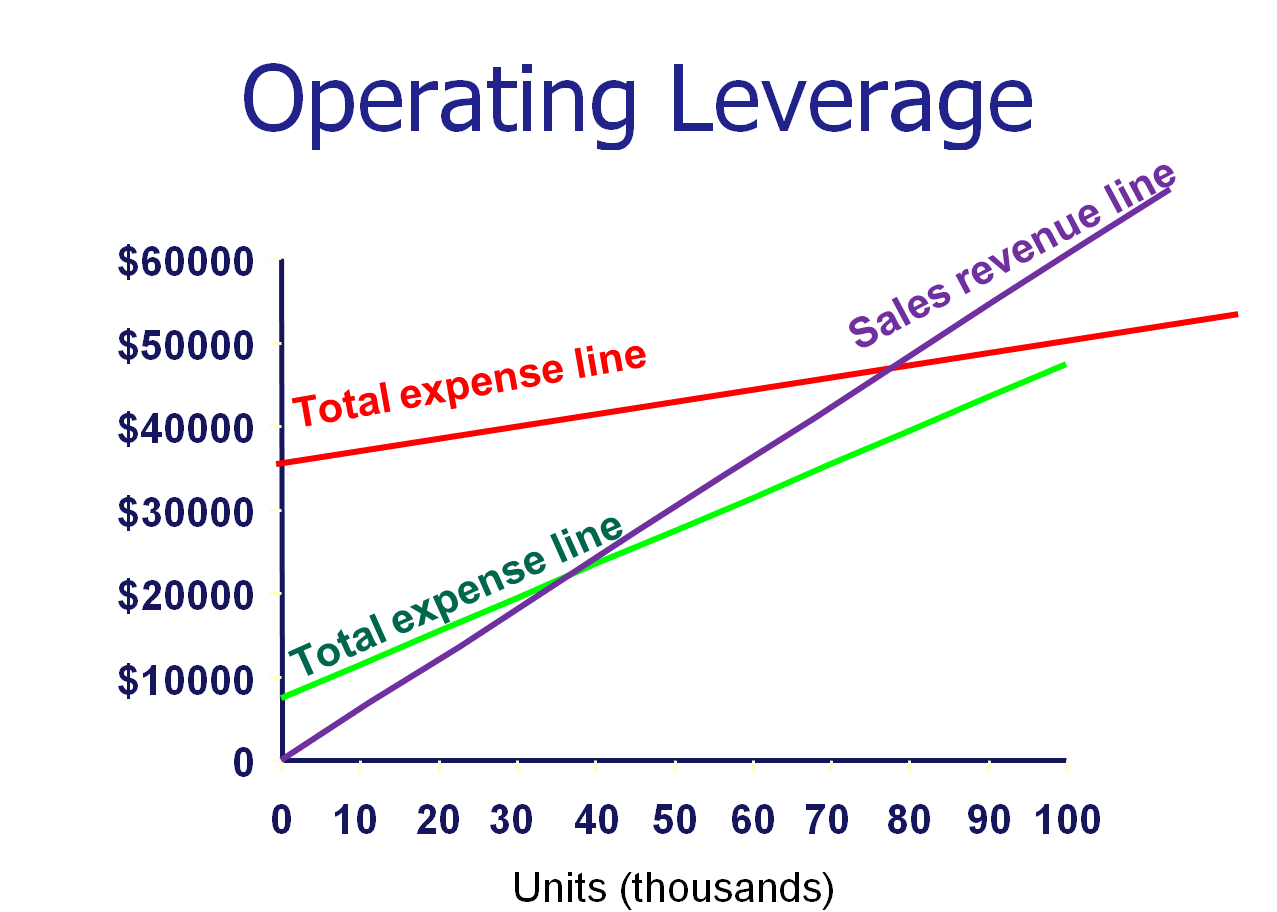
1. Deciding on the operating leverage of a business
The operating leverage of a business is the ratio of fixed to variable costs. Highly leveraged businesses have a higher proportion of fixed costs to variable costs. Usually, this means that there are highly automated (machinery-related expenses are largely fixed) with fewer staff/workers (workers’ wages are largely variable). The red line on the graph below is an example of the costs of a highly leveraged business.
A less highly leveraged business, on the other hand, has low fixed costs but higher variable costs, as can be seen by the green line in the graph. Notice that the variable costs increase at a quicker rate as compared to the highly leveraged business. An example of a low leverage business is one that has many workers but little machinery – most things are done manually.
There are pros and cons to both situations.
For a highly leveraged business, once the initial investment into automation has been made, future variable costs will be reduced and the profitability rate will be higher. Notice the larger gap between the Sales Revenue line and the Total Expense line after break-even point. However, the risk is higher, especially in an economic downturn. If sales revenue were to decrease, the chance of making losses is higher as it would be harder to “lay off” machinery, which make up the bulk of the costs.
For a low leveraged business, profitability is achieved faster, but the rate of profits gained is slow – notice the smaller gap between the Sales Revenue line and the Total Expense line. But the risks faced by the business in an economic downturn is less. If revenue falls, the business can downsize by laying off its workers and thus reducing its variable costs.
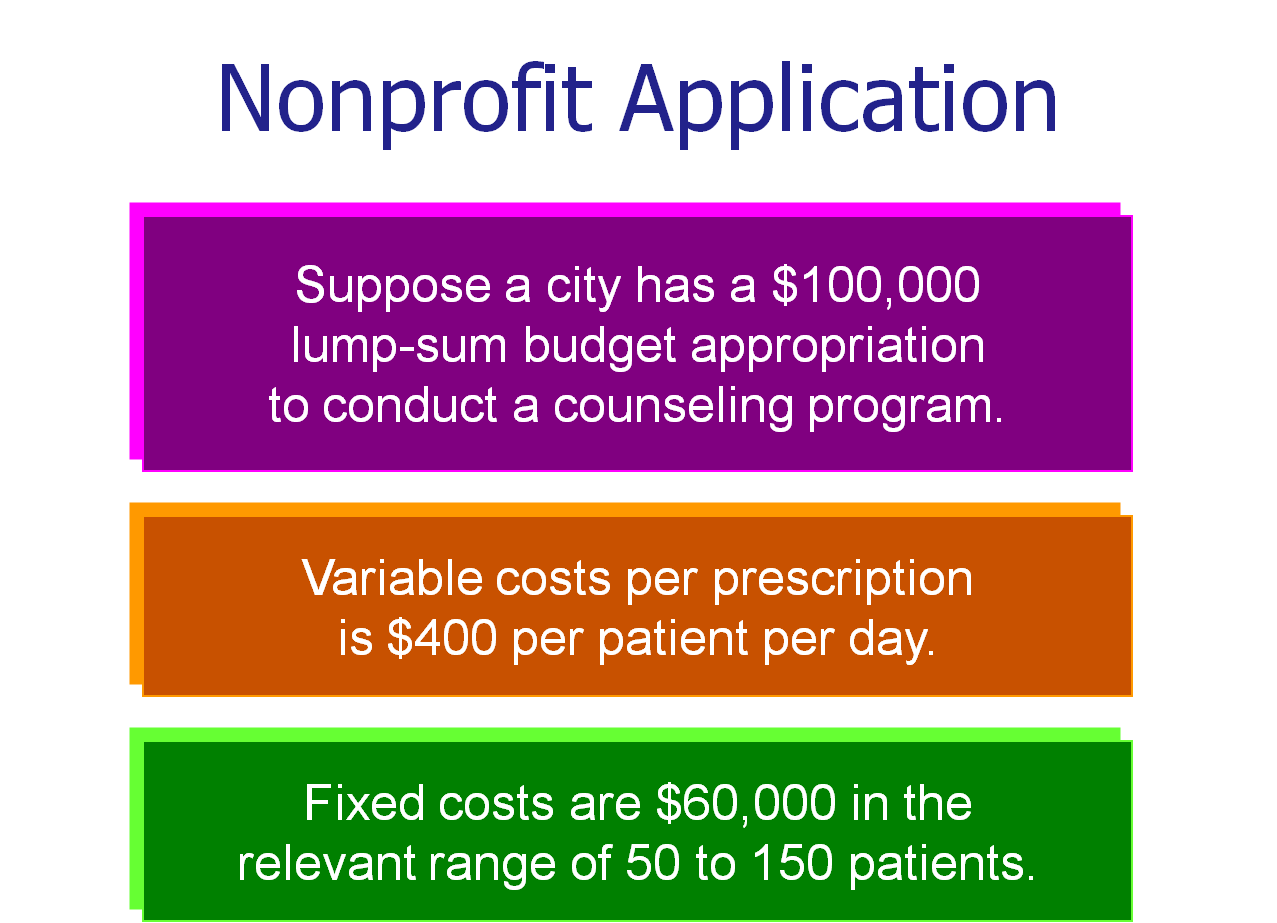
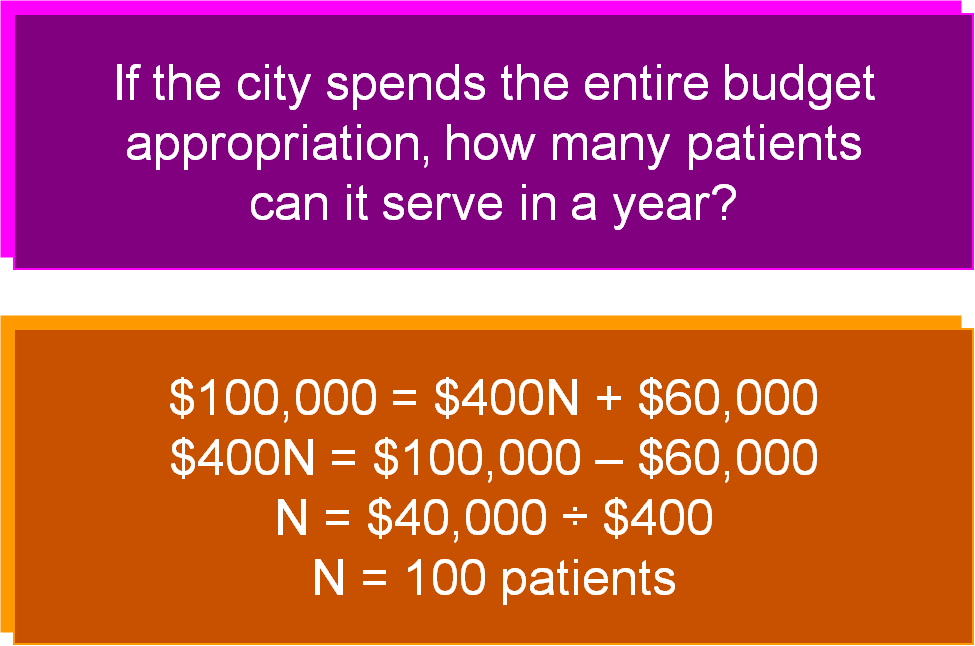
1. Non-Profit application
CVP analysis can be used in a non-profit application.
Return to Introduction to Management Accounting from Cost-Volume-Profit Analysis.